
WBN News Corp Inc.™ · Market Intelligence
Guru Index™
Signals Before the Storm.
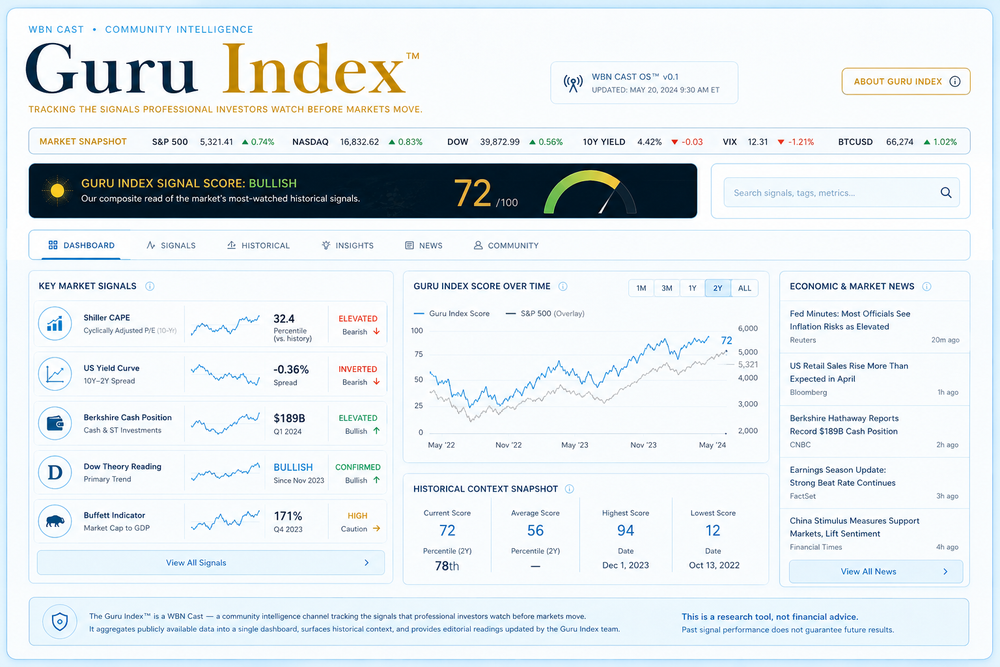
Market Signal Intelligence Dashboard
Guru Index™:
Signals Before the Storm. · Shiller CAPE · Yield Curve · Berkshire Cash · Dow Theory · Buffett Indicator · Economic Intelligence
Shiller CAPE Ratio — Historical View
Cyclically Adjusted P/E · Yale data · Updated monthly
The Shiller P/E (CAPE) ratio adjusts for inflation over a 10-year earnings average. Historically readings above 30 have preceded significant corrections. The 1929 peak was ~32. The dot-com peak was ~44. Current readings warrant attention.
US Yield Curve — 10yr vs 2yr Spread
An inverted yield curve has preceded every US recession since 1955
When the 2-year yield rises above the 10-year yield the curve inverts — historically one of the most reliable recession predictors. The curve recently re-inverted and is being monitored closely.
Shiller CAPE Ratio — Full Analysis
Robert Shiller · Yale University · Nobel Prize Economics 2013
Current CAPE
—
As of last admin update
Overvalued
Historical Average
16.8
Long-run mean since 1871
Baseline
Warning Threshold
30+
Above 30 = elevated risk historically
Watch Level
Historical Context
The CAPE ratio peaked at ~32 in 1929 before the Great Depression. At ~44 in 2000 before the dot-com crash. At ~27 in 2007 before the financial crisis. Each time elevated CAPE readings persisted, a significant correction followed — though timing is never guaranteed. The current reading suggests mean reversion is likely at some point.
US Treasury Yield Curve
10-Year vs 2-Year Treasury Spread · FRED / Federal Reserve
Current Spread
—
10yr minus 2yr (basis points)
Loading
Inversion Record
8/8
Recessions preceded by inversion since 1955
High Reliability
Avg Lead Time
~12mo
Recession typically follows 6-24 months after inversion
Historical
What Inversion Means
When short-term rates exceed long-term rates, bond markets are signalling that they expect economic conditions to deteriorate. Banks find it unprofitable to lend (borrowing short, lending long), credit contracts, and growth slows. The 2022-2023 inversion was the deepest in 40 years.
Berkshire Hathaway Cash Position
Warren Buffett's cash reserve as a market signal · SEC 10-Q / 10-K filings
Current Cash
—
Enter in Admin
Admin Update Required
% of Assets
—
Cash as % of total portfolio — elevated = caution
Monitor
Buffett Reading
—
Admin editorial note
Editorial
The Berkshire Signal
Berkshire Hathaway's cash position has historically been a meaningful contra-indicator. When Buffett holds unusually large cash reserves — finding "nothing worth buying" — it suggests he views the market as overpriced. Preceded significant market events in 2000 and 2008. Current position is at historically elevated levels.
Buffett Indicator
Total US Market Cap ÷ GDP · "Probably the best single measure of where valuations stand"
Current Reading
—
Market cap as % of GDP
Significantly Overvalued
Fair Value Zone
75–90%
Historically fair value range
Baseline
Danger Zone
140%+
Buffett described 200%+ as "playing with fire"
Extreme
Buffett's Own Words
Warren Buffett called the market cap to GDP ratio "probably the best single measure of where valuations stand at any given moment." When this ratio reaches significantly elevated levels — well above 100% of GDP — it historically signals that equity markets are priced for perfection and vulnerable to significant mean reversion.
Economic Intelligence Feed
Curated economic and market news — updated in real time
Loading economic news...
Admin — Guru Index™
Manage signals, readings, ticker, and data.
Shiller CAPE Ratio
Yield Curve (10yr - 2yr Spread)
Berkshire Hathaway Cash Position
Buffett Indicator (Market Cap / GDP)
Dow Theory Reading
Ticker Message
Sponsor Button
Edition Settings
Sponsor Analytics
No sponsor data yet.
Data Management
Backup and restore all Guru Index signal readings and settings.
Danger Zone
Role Management
Each role has its own password.
Super Admin — Full Access
Admin — Standard Access
Editor — Signal Updates Only
| Feature | Super Admin | Admin | Editor |
|---|---|---|---|
| Signal Readings | ✅ | ✅ | ✅ |
| Marketing / Ticker | ✅ | ✅ | — |
| Sponsorship | ✅ | ✅ | — |
| Data Backup | ✅ | ✅ | — |
| Clear All | ✅ | — | — |
| Permissions | ✅ | — | — |
WBN CastNetwork™
Information That Knows Where It's Going
The Guru Index™ is a WBN Cast — a community intelligence channel tracking the signals that professional investors watch before markets move. It aggregates publicly available data into a single dashboard, surfaces historical context, and provides editorial readings updated by the Guru Index team. This is a research tool, not financial advice. Past signal performance does not guarantee future results.
Past — Historical Signal Data
Present — Current Readings
Future — Pattern Intelligence
🇺🇸 Dow Jones Industrial Average
Core US industrial market signal
🇺🇸 NASDAQ Composite
AI, semiconductor, and technology signal
🇺🇸 S&P 500
Broad US market valuation indicator
🇨🇦 TSX Composite
Canadian banking, mining, energy, and housing signal
🏦 Berkshire Hathaway Cash Position Indicator™
Buffett cash accumulation vs Dow Jones historical overlay
🌍 Economic Signal Intelligence Feed™
Live macroeconomic signals affecting markets, liquidity, inflation, AI disruption, and systemic risk
Market Risk
Federal Reserve Signals Concern Over Inflation Persistence
Officials continue monitoring inflation pressure as markets reassess future rate cuts and liquidity conditions.
Reuters Business · May 15, 2026